Book a free demo
Oops! Something went wrong while submitting the form.
November 3, 2025

A restaurant’s profitability depends on how each item performs and not just how the menu looks. Tracking which dishes sell the most and which generate the highest margins is essential to maintaining control over costs and pricing.
Menu prices at full-service restaurants rose 4.6% year-over-year in August 2025. This is the fastest increase since September 2023. With rising expenses across ingredients, labor, and delivery, understanding your menu mix percentage is more important than ever.
Menu mix analysis helps you identify which items drive revenue, which ones drag down profits, and how to rebalance your offerings for better performance. This guide breaks down the menu mix percentage formula, shows you how to calculate it, and explains how to use the results to make smarter, more profitable menu decisions.
Key takeaways:
Menu mix percentage is a metric that shows the percentage of each dish's contribution to your restaurant’s total sales. It helps you understand which items are driving revenue and which ones may not be performing as well as expected.
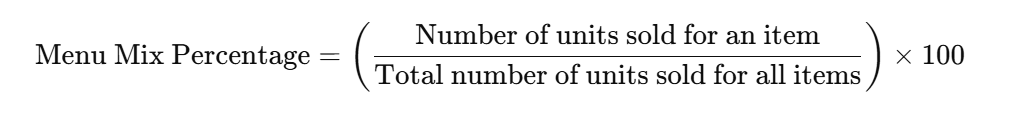
The calculation is simple:
It measures the proportion of a specific menu item’s sales against the total number of items sold during a given period. The result, expressed as a percentage, reveals how popular each item is compared to the rest of your menu.

Example:
If you sold 30 pasta dishes out of 100 total menu items in a week:

This means pasta accounts for 30% of total menu sales. You can calculate this percentage for each item to understand your overall menu performance and identify which dishes are truly pulling their weight.
You can spot trends, identify bestsellers, and make informed decisions about menu placement, pricing, and promotions. The stepwise calculation is explained in the next section to help you better understand.
Getting your menu mix percentage right gives you a clear view of which dishes are pulling their weight and which are holding back your profits.

Follow these five steps to turn raw sales data into actionable insights that can improve your menu strategy.
Start by seeing exactly what’s moving off your menu. You can do this by checking every channel your restaurant uses:
Once collected, organize the data by item to make patterns easier to spot. Doing this regularly helps you quickly identify bestsellers and spot items that may need rethinking, whether it’s pricing, promotion, or recipe tweaks.
Before calculating percentages, you need a clear total of all items sold.
Knowing the total also lets you compare categories, like appetizers vs. entrees, to see which sections of your menu are most profitable.
Now it’s time to put the numbers to work:
This step turns raw sales into a clear snapshot of performance, letting you spot which dishes are your real stars and which might be dragging down your profits.
After getting the percentages, classify your items to make decisions easier. You can use the following categories:
Breaking items into categories helps you decide which dishes to spotlight, which to tweak, and which to retire from your menu entirely.
Finally, turn data into action:
iOrders makes this step easier by surfacing real-time ordering trends across dine-in, takeout, and delivery channels. Its intuitive dashboard helps operators compare item-level sales with margins. You can easily flag underperformers and upsell opportunities. According to iOrders user data collected over a 12-month period, restaurants experienced a 288% increase in revenue compared to the previous year. Schedule your free demo today.
The next step is using these insights to optimize your menu for higher profitability and customer satisfaction.
Suggested Read: Why Commission-Free Online Ordering Is the Future for Restaurants
Once you know your menu mix percentages, it’s time to act. These insights show which dishes drive profits and which ones need attention. Implementing the right strategies can improve sales, boost customer satisfaction, and make your menu easier to manage.
Cutting underperforming items keeps your menu focused and profitable. Simplifying your offerings reduces kitchen stress and improves service speed. Focus on the following actions:
Starbucks has plans to trim 30% of its menu to improve delivery times. You can do something similar and gain from faster kitchen execution, reduced inventory waste, and clearer customer choices.
A well-designed menu can guide customer choices and increase revenue. Small tweaks in placement and visuals can make a big difference. Use these strategies:
Domino’s keeps redesigning its menu layout to improve perception and increase sales. Menu mix data should be used to spotlight high-margin items, simplify decision-making, and guide customers toward more profitable choices
Adjusting prices based on performance and demand can improve profits without hurting sales. Here’s how:
McDonald’s uses dynamic pricing on digital menu boards, adjusting based on weather, time, and location. Menu mix data lets you engineer price shifts that feel invisible to customers but meaningful to margins.
Digital tools make menu decisions smarter and faster. They help track sales, inventory, and customer feedback. You can use technology in the following ways:
iOrders gives restaurants complete control over their menu—from pricing and layout to performance tracking—across dine-in, takeout, and delivery. Operators can instantly adjust item visibility, test bundles, and monitor how changes impact sales and margins in real time.
Your menu should evolve with customer preferences and industry trends. Regular updates keep it fresh and profitable. Key actions include:
Regular reviews backed by menu mix data help you retire underperformers, spotlight rising stars, and stay ahead of shifting demand. The goal isn’t just variety—it’s strategic relevance that drives repeat orders and higher margins.
By applying these strategies, you can turn menu mix insights into real profits. Next, we will explore why performing a menu mix analysis is essential for any restaurant looking to maximize revenue and efficiency.
Suggested Read: Cloud Kitchen Price Breakdown 2025: Real Costs, Smart Savings
A menu mix analysis gives you a clear picture of which dishes are driving revenue and which may be costing you money. Understanding the performance of every item helps you make smarter, data-driven decisions.

Restaurants conduct this analysis for several important reasons:
Conducting a menu mix analysis is powerful, but it’s only effective if you avoid common pitfalls. Next, we will explore the mistakes that can distort your data and mislead your menu strategy.
Even with the best data, it’s easy to make mistakes when analyzing your menu mix. Ignoring certain factors can lead to misleading conclusions and poor decisions.
Watch out for these common pitfalls:
Pairing insights with the right tools takes your menu strategy to the next level. To turn menu mix insights into action, you need a platform that connects data with execution. That’s where iOrders comes in. It gives restaurant operators full control over menu visibility, pricing, and performance across all ordering channels.
Suggested Read: How to Set Profitable Food Delivery Fees for Your Restaurant
iOrders is a comprehensive digital platform for restaurants that centralizes online ordering, delivery, and marketing operations. It eliminates high commissions from third-party apps, giving restaurants full control over their brand and customer data.

With iOrders, you can increase revenue, improve customer retention, and make smarter menu-level decisions using real-time insights and automation. And, this is because of the following features:
iOrders allows you to accept orders directly from your website or app without paying the usual 15–30% commissions to third-party platforms. This preserves your margins while keeping your brand front and center on every order. Tracking customer behavior and sales trends helps you identify top-performing items and adjust your menu for maximum profitability.
Customers can place orders easily through your website or by scanning a QR code, making the ordering experience fast and seamless. Orders are automatically synced with your POS, reducing errors and improving kitchen operations. This convenience encourages repeat business while giving you full control over pricing, promotions, and menu adjustments.
iOrders integrates with third-party logistics providers like Uber Direct or DoorDash Drive, allowing you to offer fast, reliable delivery without hiring drivers. Restaurants pay only a flat delivery fee, with no commission on the order value, keeping margins intact. Customers receive a branded, easy delivery experience, strengthening loyalty and satisfaction.
With iOrders, you can create targeted marketing campaigns based on customer behavior and preferences. The platform provides actionable insights to improve engagement and maximize the impact of promotions. Personalized messaging helps you strengthen relationships and increase repeat visits.
iOrders makes it easy to implement loyalty programs that reward repeat customers and encourage referrals. You can track customer activity and tailor rewards to increase engagement and average order value. Well-designed loyalty programs turn casual diners into long-term, profitable patrons.
The platform uses data-driven insights to help you launch campaigns that proactively engage your audience. Offers can be personalized based on purchase history, preferences, or seasonal trends. These strategies improve customer lifetime value while minimizing marketing waste.
iOrders uses AI to automate responses to reviews, FAQs, and comments while maintaining a professional tone. This reduces staff workload and ensures consistent communication with customers. Insights from feedback help refine menu items and improve service quality.
Your restaurant can offer a fully branded mobile app for dine-in, pickup, or delivery orders. The app is customizable, easy to use, and encourages repeat orders through a seamless user experience. Direct ordering through the app keeps your brand visible and strengthens customer relationships.
By using iOrders’ tools, restaurants have achieved a 13% rise in average basket size and stronger customer loyalty.
As Raj Patel, a restaurant owner nad iOrders user, shares, “The delivery assistance service provided by iOrders has streamlined our operations. Our orders are now dispatched efficiently, and customer satisfaction has improved tremendously. It has allowed us to focus on what we do best—cooking great food!”
Ready to turn menu data into profit? Try iOrders and take full control of your pricing, layout, and performance—across every channel.
Understanding your menu mix percentage is essential for running a profitable restaurant. By calculating the proportion of each item sold relative to total sales, you can identify which dishes drive revenue, which need promotion, and which may be holding your profits back. Applying the menu mix percentage formula consistently helps you make informed menu decisions.
Using iOrders takes these insights a step further by giving you the tools to act on them. From commission-free ordering and delivery management to targeted marketing and AI-powered customer engagement, iOrders helps you optimize your menu. The tool helps increase sales and strengthen customer loyalty.
Start maximizing profits and delighting customers immediately. Schedule your free demo today.
It depends on your sales volume and menu changes. Many restaurants review monthly or quarterly, but high-volume or seasonal businesses may benefit from weekly checks.
Yes, iOrders supports POS integration, allowing seamless order syncing, real-time inventory tracking, and accurate sales reporting without manual entry.
Not necessarily. While spreadsheets work, digital tools like iOrders streamline the process, reducing manual work and providing actionable insights automatically.
A proper menu mix analysis should include both sales volume and item profitability. This ensures you focus on dishes that drive revenue and maximize profits.
Absolutely. You can track new dishes in real time, gather customer feedback, and see how they impact overall menu performance before committing long-term.
.png)